Background
All source code for this post can be found here
Last year I moved my custom home automation to a literally in-house Kubernetes cluster.
There were many immediate benefits, but one long-term goal was to add monitoring, dashboards, and maybe alerts.
A good dashboard quickly answers the question “is something wrong?”. A great dashboard points directly at the root of the problem. Both require quality metrics.
Hosting applications on Kubernetes, particularly if they’re designed specifically to run on Kubernetes (e.g. using Kubernetes Cronjobs for recurring tasks, versus in-app constructs like “background jobs”), means we can leverage open source metric exporters like kube-state-metrics.
What problem am I trying to solve?
I have a number of Kubernetes Cronjobs that automate various important things. I’d like to know when/if any of those jobs fail to run.
In the case of the chime, it’s fairly obvious - I don’t hear the chime that day.
In the case of the backups, I’d have to go check individual Github repos, or inelegantly review my jobs in kubectl or k9s.
Instead, I’d like to look at a dashboard, hosted at a nice URL, of all my Cronjobs and have the dashboard point out if anything failed to run.
What’s the simplest approach?
The simplest approach is an all-in-one package like Prometheus Operator, installing a full monitoring and dashboarding stack in one shot.
The next simplest approach is the kube-prometheus-stack Helm Chart, which does basically the same thing as the Operator, but differently.
I chose the third simplest approach, installing Prometheus and Grafana from their own separate Helm Charts.
I believe this choice gave me the best balance of simplicity, ease of maintenance, and focused learning. In the future, should I discover a need for a CRD-based deployment, it should be simple to migrate to the Operator. Storing my dashboards as IaC makes it easy to swap out the underlying Prometheus and Grafana installations.
Pulumi
My IaC platform for this project is Pulumi. Pulumi offers two ways to install Helm charts: a Chart Resource, or a Release Resource.
I used Pulumi’s handy guide and chose a Release, since I’m going for their first use case: Fire-and-forget.
It worked out well!
Pinning
I pinned both Helm charts to specific versions.
I don’t want accidental upgrades of these charts the next time I pulumi up. It may also be worthwhile to pin all the images used by the Helm chart, for the same reason.
Challenges
Ingress confguration
Both charts required a little bit of customization to support mounting their Ingress URLs at subpaths. I want to navigate to http://my-homelab/prometheus and http://my-homelab/grafana. By default, both Prometheus and Grafana ingresses mount at /.
I configured both Ingresses to rewrite URLs.
"ingress": {
    "enabled": True,
    "ingressClassName": "public",
    "annotations": {
        "nginx.ingress.kubernetes.io/rewrite-target": "/$2",
    },
    "path": "/grafana(/|$)(.*)",
    "hosts": [""],
}
I also configured both Prometheus and Grafana to recognize they were serving from a subpath. I recently set up an application that lacks this configurability1, and so couldn’t mount it cleanly under a subfolder.
Datasource URL
Grafana needs to know where to find Prometheus. I expected I could use a Kubernetes internal DNS name as I do elsewhere in my cluster. But for reasons unknown (I suspect some configuration issue in the Grafana pods), that didn’t work. Using a non-FQDN worked.
Using the Operator or kube-prometheus-stack probably would have sidestepped this issue for me, but it’s more of a mystery than a blocker. I can loop back and figure it out later, and proceed now to building dashboards, which is the actual, practical point of this exercise.
Rolling it out
Once I’d gotten the Helm charts configured, deployment was as simple as pulumi up. Then I could navigate my browser to http://my-homelab/prometheus and see some metrics!
Likewise, http://my-homelab/grafana renders a Grafana website, hooked up to my Prometheus instance publishing all the metrics exported by kube-state-metrics and node-exporters - all without me instrumenting any of my application code.
Time to build a dashboard!
A Useful Dashboard
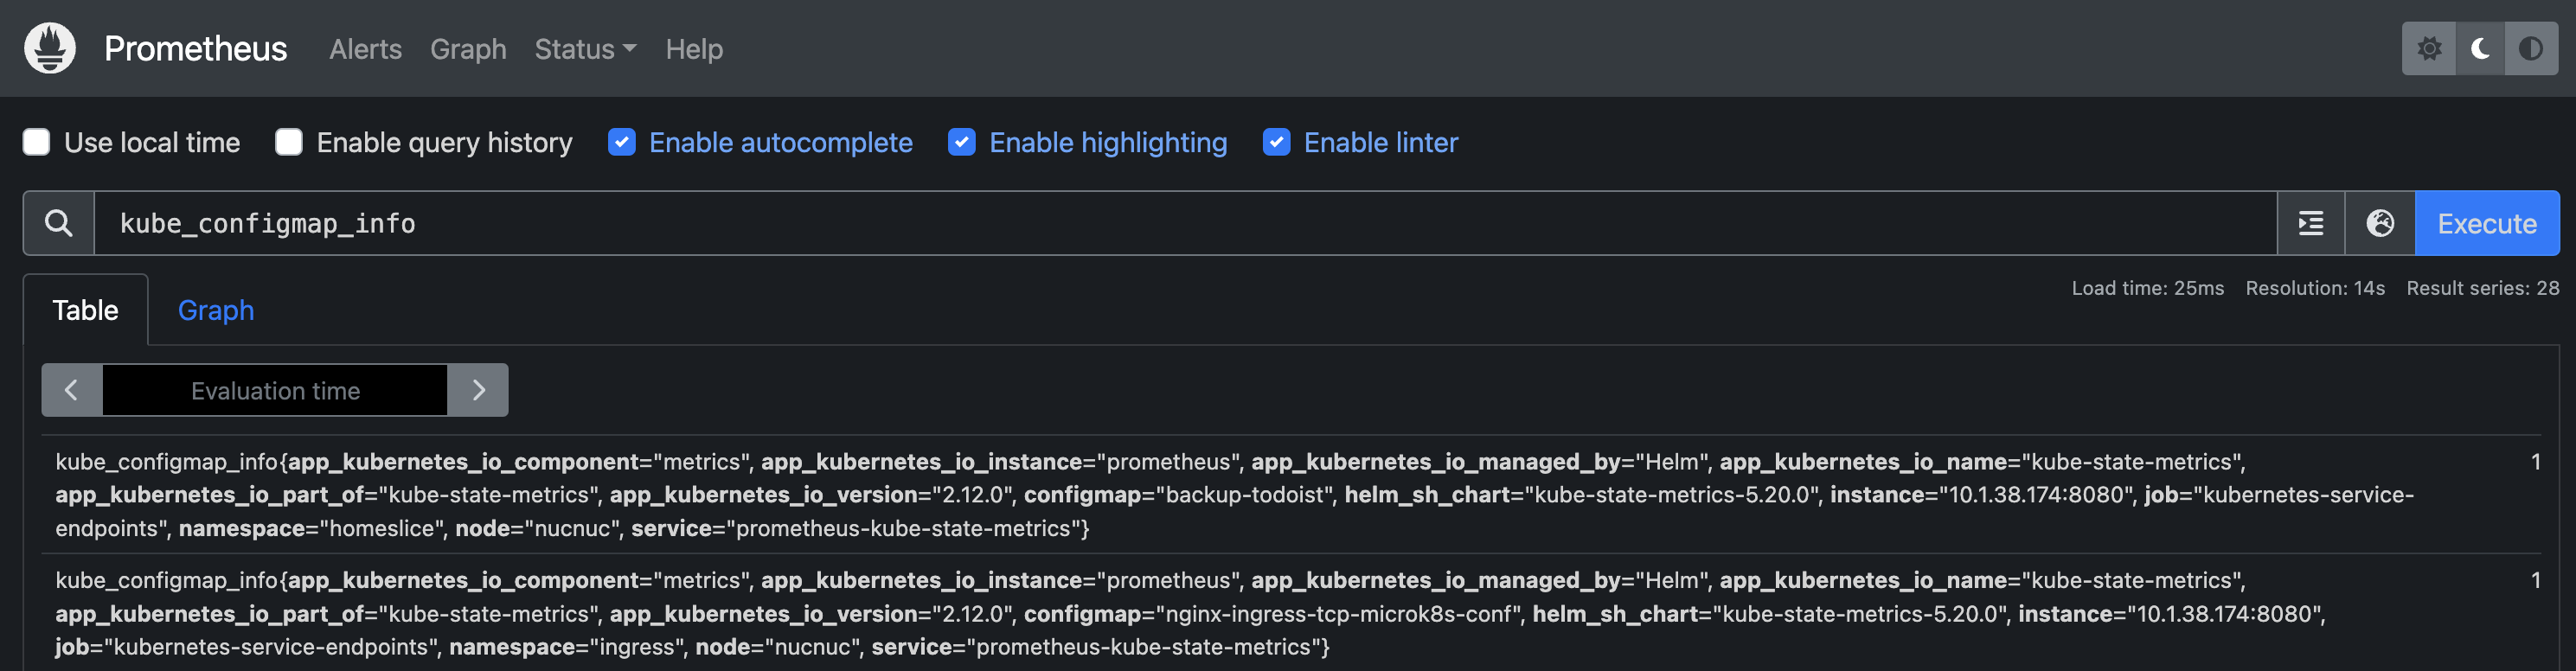
I want to know if my Cronjobs failed, and I don’t want to instrument my code to publish those signals. Fortunately for me, kube-state-metrics, bundled in the Prometheus Helm chart, gives me what I need. It’s not exactly straightforward to get an answer to the seemingly simple question “is my Cronjob healthy?”, but it’s possible. With working PromQL in hand, a nice dashboard is simple.
The PromQL Query
time() - max(kube_job_status_succeeded{namespace=\"homeslice\",job_name=~\"$cronjob.*\"} * on (job_name) kube_job_created{namespace=\"homeslice\",job_name=~\"$cronjob.*\"})
Cronjob names are parameterized as $cronjob so that I can use one query for all the Cronjobs in my homeslice namespace. I take the current time, subtract from it the time of the most recent successful job (which is not exactly straightforward to identify). That yields the time since the last successful run.
As it happens, all of my Cronjobs are intended to run at least once daily, so given the time since the last successful run, I can indicate on my dashboard that no jobs have succeeded within 24-ish hours.
That should suffice to answer my question of, “are my Cronjobs healthy?”
The Grafana Bits
I want my dashboards to be managed as IaC. Lucky for me, Grafana dashboards can be specified right in the Helm values. Even better, I can build them in Grafana’s nice GUI, then export them to the JSON format expected by the Helm chart.
Specifying the Dashboards in my Pulumi repo has many advantages. For example, it’s easier to share the dashboards, they’re versioned (by git), and if I mess them up manually, they’re easily restored.
Here’s a portion of the finished dashboard:
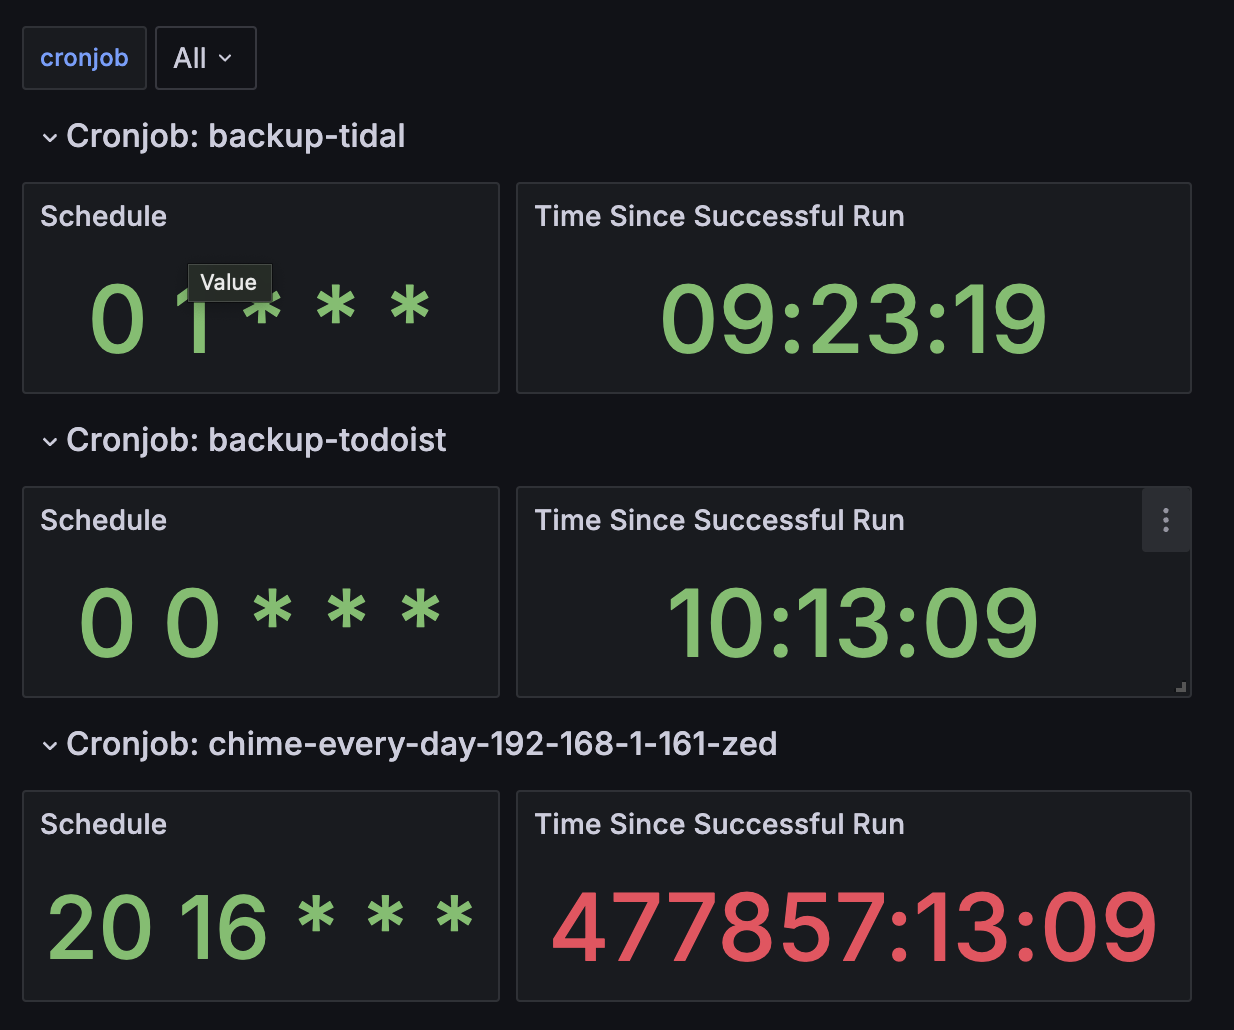
We can see, immediately at a glance, that there’s something wrong with chime-every-day-192-168-1-161-zed - it hasn’t run in a very long time. The wrongness is indicated both by the huge (meaningless) number and by the color red.
There are three main components.
The cronjob Selector
At the top,
cronjob: [All]
With this Selector, I can see all my Cronjobs or zero in on a single one. Creating this UI element also creates a Variable which I can use to write code just once, to be re-used automatically for each Cronjob in my namespace.
To set that up, Dashboard Settings > Variables > New Variable, and Query the cronjob label of the kube_cronjob_info metric. Enable Multi-value and Include All option. Name the variable cronjob.
The Schedule panel
Is a Cronjob schedule really a metric? Well, it’s available as a metric, and I’d rather use it than argue about what it is2!
I used a Stat visualization to show a single “statistic”. I used a Last* Calculation on the Field “schedule”. The Query Format is Table, and the query itself looks like this:
topk(1,kube_cronjob_info{cronjob="$cronjob",namespace="homeslice"})
topk gets the “largest” k metrics. Setting k = 1 yields just one kube_cronjob_info metric3.
There’s no meaningful Thresholds here, the schedule just is, it can never be out of bounds.
The Time Since Successful Run panel
Here’s where I used the PromQL Query from above. Set the format to table, use a Stat visualization, change the Standard Options Unit to duration hh:mm:ss. Set the red Threshold to 90000, which is about 25 hours - after which my Cronjob is definitely overdue.
Between these two panels I have all I need to see, at a glance, if there’s a problem with my scheduled tasks.
Making the JSON
Once the dashboard looks nice enough, it’s time to export it to JSON so I can manage it with IaC. Dashboard Settings > Save Dashboard > Save JSON to file and drop it into the Pulumi repo.
Finishing up the IaC
Wouldn’t it be cool if I could just drop any number of Grafana dashboard JSONs into my repo and have a single pulumi up deploy them all? Yes, that would be cool! In fact, it’s also quite easy!
I didn’t actually implement it, though. Instead, I wrote the solution for just a single JSON file, because:
- That’s what I have right now
- So my code is only as complex as needs to be, no more
But all it needs is a for loop or two, then the dream can become reality.
To deploy the single dashboard I have now, I first read the file into a variable.
    with open("monitoring/dashboards/cronjobs.json", encoding="utf-8") as f:
        cronjobs_json = f.read()
Then, I use the variable in the Grafana Helm values.
                "dashboards": {
                    "homeslice": {
                        "cronjobs": {
                            "json": cronjobs_json,
                        },
                    },
                },
For this to work I also needed to set up dashboardProviders. The provider name and path must match the dashboards key I used, in this case, homeslice.
Final Thoughts
This little project went well. The infrastructure work is basically done. I need only a few extra minutes of work on the IaC to deploy multiple dashboards, and any additional time I can spend productively on making dashboards or instrumenting my application code to export metrics.
The minimalist first dashboard already has enough info to point me towards a fixable problem.
I do have other things I’d like to monitor, either via kube-state-metrics or by instrumenting my app code. I’d also like to get a low-priority alert, like an email, if my backups fail - a job for alertmanager. This project lays groundwork for lots of future play and expansion!