What?
moby/buildkit natively supports exporting OpenTelemetry traces.
We can export traces from our container builds to Jaeger.
So?
We can use traces to discover optimization opportunities in our builds and to debug performance degrades.
This can be particularly helpful for a DevOps team responsible for an organization’s container builds, when alerts or users report that “builds are slow”.
Show Me!
Makefile
First, a Makefile - quick and dirty style.
jaeger:
	docker run --rm --name jaeger \
		-p "6831:6831/udp" \
		-p "16686:16686" \
		jaegertracing/all-in-one

bootstrap:
	docker buildx create --use \
  		--name jaegerbuilder \
  		--driver docker-container \
  		--driver-opt "network=host" \
  		--driver-opt "env.JAEGER_TRACE=localhost:6831"
	docker buildx inspect --bootstrap

build:
	docker buildx build -o type=docker -f Dockerfile -t otel-docker .

traces:
	open http://127.0.0.1:16686/
The jaeger target starts a Jaeger instance in the foreground. Remove the --rm and add a -d to run it in the background. I’m just playing around and I don’t need to keep this instance, so I’ll run it in the foreground for easy removal later.
The bootstrap target creates a new buildx builder instance, configured to export traces to Jaeger, and tells the docker buildx command to use the new instance.
The build target uses the bootstrapped instance to build our Dockerfile. You’ll need to run bootstrap before running build, but since bootstrap creates a new instance, I didn’t make build depend on bootstrap. If build were to depend on bootstrap, we’d try (and fail) to create a new non-unique buildx instance on each build. Improving the Makefile is beyond the scope of this post!
The traces target, on a Mac, will open a browser pointing to our Jaeger instance. Alternatively, you could remember that Jaeger listens on port… uh, just use the Makefile.
Dockerfile
This Dockerfile is for demo purposes only1.
FROM debian

RUN echo "hi"
RUN apt update -y && apt install -y vim
RUN apt update -y && apt install -y emacs
RUN sleep 2
RUN echo "spam" > /tmp/spam
Run it!
% make bootstrap
[ output omitted ]
% make jaeger &     # note the & - run Jaeger in the background
% make build
[ output omitted ]
% make traces
% fg                # bring Jaeger back to the foreground
View in the browser
If you’re on Mac, make traces opened Jaeger in your browser. Otherwise, navigate to http://localhost:16686. Select the buildx Service, and look at the buildx: build trace. Here’s some of what I see:
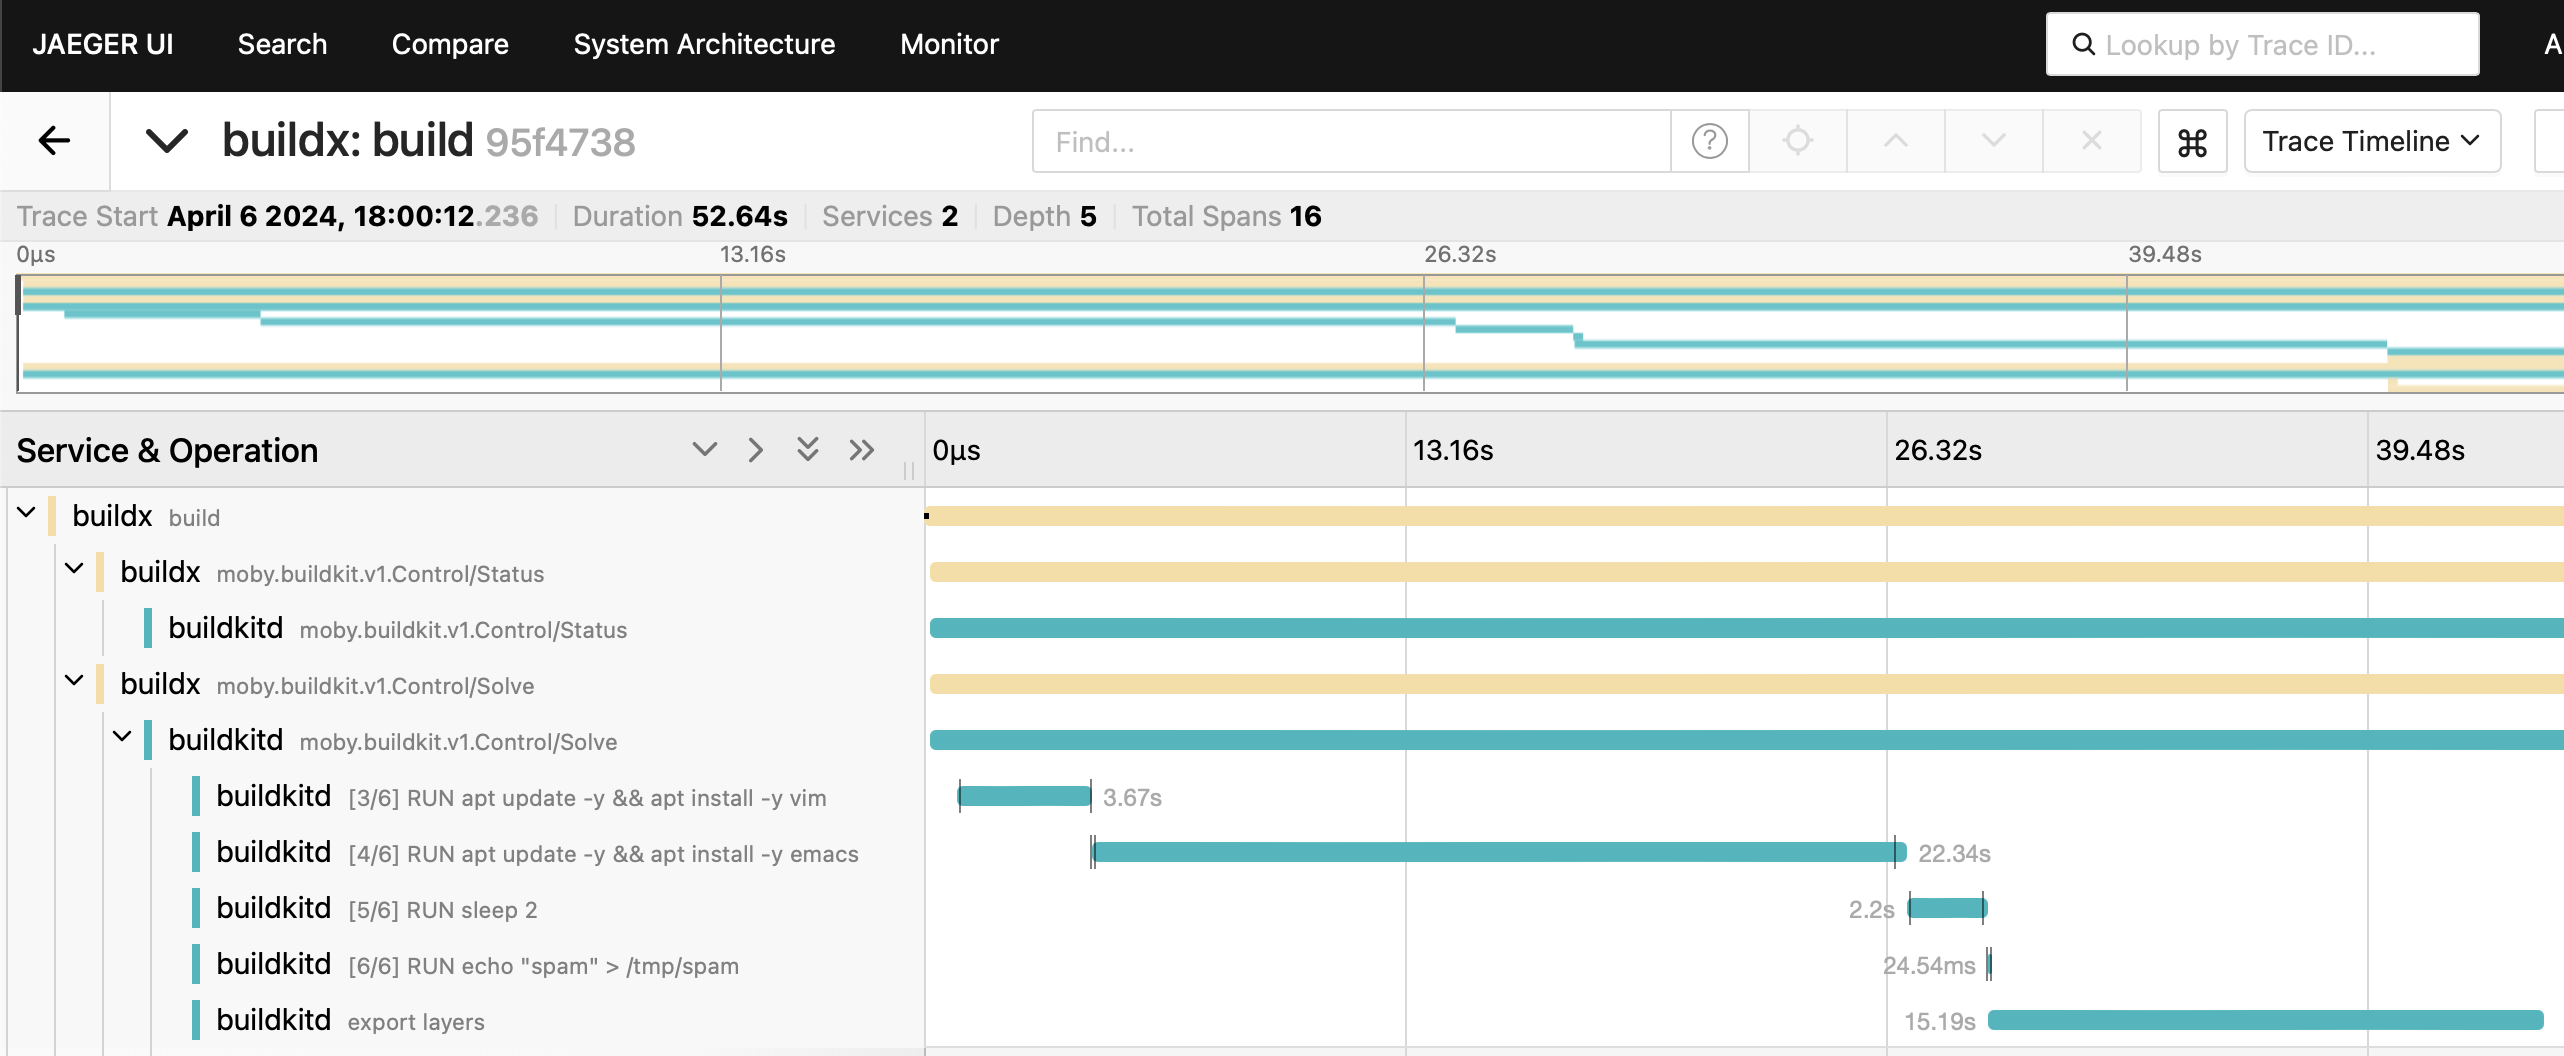
Right away we can see that RUN apt update -y && apt install -y emacs accounts for the majority of our build time. We can now decide what we want to do about it. We could combine that line with the previous line, or we could find a smaller distribution of emacs, or - well, the possibilities are almost endless.
What was all that about?
This is a trivial, contrived example with a boring Dockerfile and a single trace. In fact, the docker CLI already prints layer timing to stdout. You didn’t need distributed tracing to figure out why this build was slow.
But imagine you’re doing thousands of image builds a day, and need to dig into performance issues. Historical traces can help you determine when things got slow (maybe you don’t have dedicated build metrics), then correlate with changes to your Dockerfiles, source code, build environment, and dependency chains. It’s much easier to look at a list of traces than to dig through build logs, which probably contain lots of other information (AKA “noise”), and may not be easily accessible in aggregate.
Maybe when you look at your traces, you discover that all your Dockerfile’s commands run quickly, but pushing to your registry is regrettably slow.
Or maybe you’re just a developer who wants a robust historical log of your Dockerfile improvements over time.
The possibilities are endless, and the traces are very easy to set up!
-
For actual use, you’d never install
emacs. ↩