What?
I read the book Cloud Native Go. The “extra credit” assignments were fun and interesting, and the opportunities to practice1 writing code were endless.
The final chapter on Observability and OpenTelemetry is the subject of this post. In the brief time since the publishing of the book, OpenTelemetry has come a long way, and the examples needed some work to compile. Of all the things I learned in the book, the final chapter may be the one that most immediately applicable for me.
Source code for this post can be found here.
Why?
“Learn by doing” is my motto. I didn’t invent it, but I learned it… by doing.
I learn best by actually writing code, especially code that answers the questions that arise while reading about code. I wondered how the book’s channels and goroutines implementation would perform compared to some more traditional implementations. Go’s builtin benchmarking tools make it easy to answer such questions, and its builtin testing framework revealed a bug in the book’s implemetation2.
% go test -bench .
goos: darwin
goarch: arm64
pkg: mp/fib/pkg/fib
BenchmarkIterate-8           	  168403	      7211 ns/op
BenchmarkRecurse-8           	      33	  34326386 ns/op
BenchmarkRecurseWithMemo-8   	    3981	    297457 ns/op
BenchmarkChannel-8           	      19	  61818140 ns/op
PASS
ok  	mp/fib/pkg/fib	5.177s
Unsurprisingly, the iterative Fibonacci implementation is faster than the recursive one, and the memoized recursive one is faster than the plain recursive one. But I didn’t expect the book’s channels and goroutines implementation to be so much slower than using recursion!
Every time I write a little toy application, I pick up another cool trick or two, and roll it in to my standard toolkit. Particularly in throwaway code, we often write this:
thing, err := some.Func("something")
if err != nil {
	panic(err)
}
Many of these checks in a row become hard to read. We can simplify this using Go’s generics.
func check[T any](thing T, err error) T {
	if err != nil {
		panic(err)
	}
	return thing
}

func main() {
	thing := check(some.Func("something")) // we weren't doing real error checking anyways
}
Let’s instrument Fibonacci
We’ll start with some code, but the real payoff comes from running Jaeger.
First, of course, we’ll write a test. I’ve omitted some imports for simplicity here. Full code is here.
package fib_test

// A list of Fibonacci numbers that we will use in our tests
var want []int

// we can't declare a const slice of ints, but we can initialize a var at init() time
func init() {
	// add more to make your tests run slower
	want = []int{0, 1, 1, 2, 3, 5, 8, 13, 21, 34, 55, 89, 144, 233, 377, 610, 987, 1597, 2584}
}

func TestFibonacci(t *testing.T) {
	for i := 0; i < len(want); i++ {
		got := fib.Recurse(i)
		require.Equal(t, want[i], got)
	}
}
Run the test, watch it fail. Hooray!
We’ll implement recusive Fibonacci first. It won’t win any efficiency contests, but it’s easy to understand.
package fib

func Recurse(num uint) (uint) {
	if num <= 1 {
		return num
	}
	return Recurse(num-2) + Recurse(num-1)
}
Clean and simple. Let’s instrument it with OpenTelemetry.
package fib

import (
	semconv "go.opentelemetry.io/otel/semconv/v1.17.0"
)

const (
	instrumentationName    = "mp/fib"
	instrumentationVersion = "0.1.0"
)

func Recurse(ctx context.Context, num uint, memos ...Memo) (result uint) {
	tracer := otel.Tracer(instrumentationName,
		trace.WithInstrumentationVersion(instrumentationVersion),
		trace.WithSchemaURL(semconv.SchemaURL),
	)
	cctx, sp := tracer.Start(ctx,
		fmt.Sprintf("Recursive Fibonacci(%d)", num),
		trace.WithAttributes(attribute.Int("n", num)))
	defer sp.End()

	defer func() { sp.SetAttributes(attribute.Int("result", result)) }()

	if num <= 1 {
		result = num
		return
	}
	result = Recurse(cctx, num-2, memos...) + Recurse(cctx, num-1, memos...)
	return
}
We pass a context in to Recurse, and pass it down the call stack to be wrapped by tracer.Start().
Let’s fire up a Jaeger instance. We’ll write func main() in a moment. Note -e COLLECTOR_OTLP_ENABLED=true, which is required for our work here.
% docker run --name jaeger -e COLLECTOR_OTLP_ENABLED=true -p 16686:16686 -p 4317:4317 -p 4318:4318 jaegertracing/all-in-one:1.55
...
{"level":"info","ts":1711686382.7595186,"caller":"grpc@v1.62.0/clientconn.go:532","msg":"[core][Channel #1] Channel Connectivity change to READY","system":"grpc","grpc_log":true}
Great, now we are ready to implement func main() and send some traces to Jaeger!
package main

import (
	"mp/fib/pkg/fib"
	sdktrace "go.opentelemetry.io/otel/sdk/trace"
	semconv "go.opentelemetry.io/otel/semconv/v1.17.0"
	"go.opentelemetry.io/otel/trace"
)

const (
	instrumentationName    = "mp/fib"
	instrumentationVersion = "0.1.0"

	serviceName    = "fibonacci"
	serviceVersion = "0.1.0"

	otlpEndpointUrl = "http://localhost:4318/v1/traces" // http not https
)

func Resource() *resource.Resource {
	return resource.NewWithAttributes(
		semconv.SchemaURL,
		semconv.ServiceName(serviceName),
		semconv.ServiceVersion(serviceVersion),
	)
}

func InstallExportPipeline() (func(context.Context) error, error) {
	otlpExporter := check(otlptracehttp.New(context.Background(),
		otlptracehttp.WithEndpointURL(otlpEndpointUrl),
	))

	tracerProvider := sdktrace.NewTracerProvider(
		sdktrace.WithBatcher(otlpExporter),
		sdktrace.WithResource(Resource()),
	)
	otel.SetTracerProvider(tracerProvider)

	return tracerProvider.Shutdown, nil
}

func main() {
	ctx := context.Background()

	shutdown := check(InstallExportPipeline())
	defer shutdown(ctx)

	tracer := otel.GetTracerProvider().Tracer(
		instrumentationName,
		trace.WithInstrumentationVersion(instrumentationVersion),
		trace.WithSchemaURL(semconv.SchemaURL),
	)

	ctx, span := tracer.Start(ctx, "main")
	defer span.End()

	n := fib.Recurse(ctx, 10, fib.WithSimpleMemoization())
	fmt.Println(n)

	span.SetAttributes(attribute.Int("n", n))
}
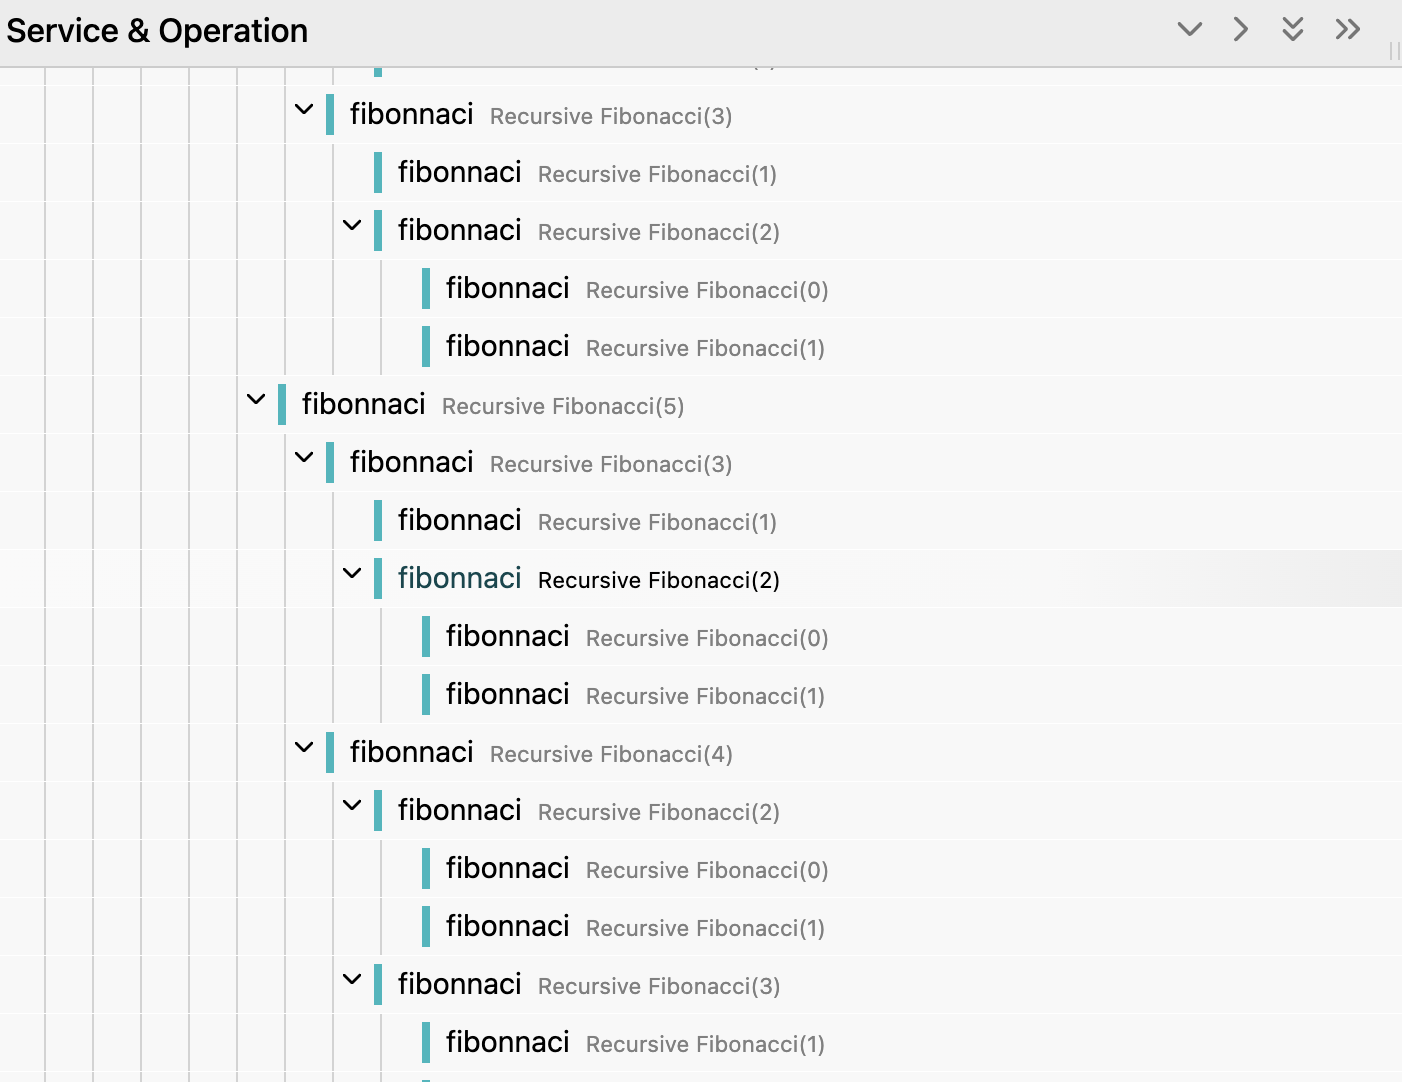
Running this code prints 55 to stdout. Also, it sends traces to our Jaeger instance. We can navigate our browser to http://localhost:16686 to see the Jaeger UI. We should see a fibonnaci service, with a fresh trace named fibonnaci:main.
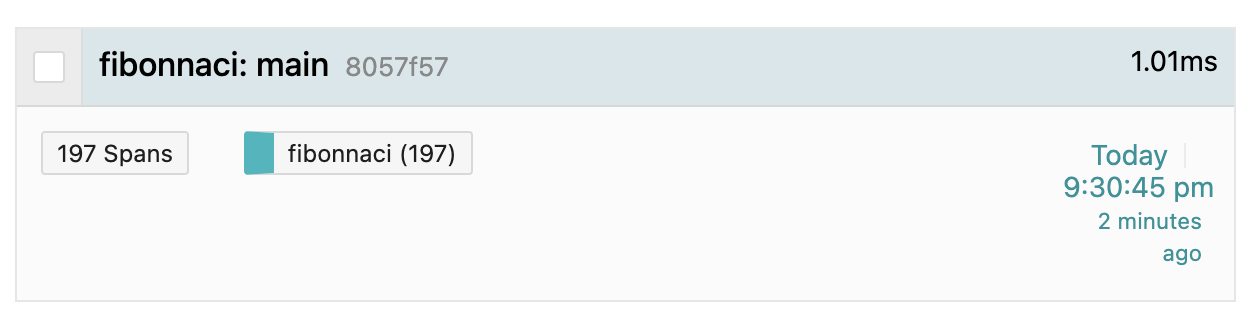
Looking at the spans3, it’s apparent that we repeat a lot of calls. Recursive Fibonacci(2) appears three times in this screenshot - the actual total is more than 3. We have 178 spans in all. Can we improve our implementation?
We can use memoization to optimize, and we can use our traces to observe that the implementation is an improvement.
package fib

type Memoizer func(int, int)

// Memo returns a memoized result for a Fibonacci number, a bool that is true if a result was returned, and a func to memoize a new result.
type Memo func(int) (int, bool, Memoizer)

// WithMemoization returns a Memo func that allows fib.Recurse to memoize results. Not safe for concurrency.
func WithSimpleMemoization() Memo {
	results := make(map[int]int)
	return func(i int) (int, bool, Memoizer) {
		v, ok := results[i]
		return v, ok, func(i, result int) {
			results[i] = result
		}
	}
}

func Recurse(ctx context.Context, num int, memos ...Memo) (result int) {
	tracer := otel.Tracer(instrumentationName,
		trace.WithInstrumentationVersion(instrumentationVersion),
		trace.WithSchemaURL(semconv.SchemaURL),
	)
	cctx, sp := tracer.Start(ctx,
		fmt.Sprintf("Recursive Fibonacci(%d)", num),
		trace.WithAttributes(attribute.Int("n", num)))
	defer sp.End()

	defer func() { sp.SetAttributes(attribute.Int("result", result)) }()

	for _, memo := range memos {
		r, ok, memoize := memo(num)
		if ok {
			sp.SetAttributes(attribute.Bool("from memo", true))
			result = r
			return
		}
		defer func() { memoize(num, result) }()
	}

	if num <= 1 {
		result = num
		return
	}
	result = Recurse(cctx, num-2, memos...) + Recurse(cctx, num-1, memos...)
	return
}
Update the call in func main().
	n = fib.Recurse(ctx, 10, fib.WithSimpleMemoization())
	fmt.Println(n)
Run it again and look at the new trace in Jaeger. It’s much smaller: only 20 spans, down from 178. There are no more than two Recursive Fibonacci(n) for any given n. Our duration is smaller, too - the code took less time to complete.
Jaeger traces helped us observe patterns in our execution, and then demonstrate that our targeted changes improved not just the actual performance in our one test case (calculating 10 Fibonacci numbers), but also the algorithm. Our new algorithm, with memoization, will scale better, and the traces, particularly when visualized as a Trace Graph, help us see why.
But traces aren’t the end of the story. They can point us towards improvements, and with end-to-end testing, confirm our improvements worked. Go provides a better tool for quantifying hightly localized improvements like ours: Benchmarking. Let’s add some benchmarks to compare our two recursive implementations.
package fib_test

func BenchmarkRecurse(b *testing.B) {
	for j := 0; j < b.N; j++ {
		for i := 0; i < len(want); i++ {
			got := fib.Recurse(context.Background(), i)
			require.Equal(b, want[i], got)
		}
	}
}

func BenchmarkRecurseWithMemo(b *testing.B) {
	for j := 0; j < b.N; j++ {
		for i := 0; i < len(want); i++ {
			got := fib.Recurse(context.Background(), i, fib.WithSimpleMemoization())
			require.Equal(b, want[i], got)
		}
	}
}
On my machine, running the benchmarks (including a few not mentioned here), I get:
```bash
% go test -bench .
goos: darwin
goarch: arm64
pkg: mp/fib/pkg/fib
BenchmarkIterate-8           	  168403	      7211 ns/op
BenchmarkRecurse-8           	      33	  34326386 ns/op
BenchmarkRecurseWithMemo-8   	    3981	    297457 ns/op
BenchmarkChannel-8           	      19	  61818140 ns/op
PASS
ok  	mp/fib/pkg/fib	5.177s
The memoization improved our benchmark by 3 orders of magnitude!4 And we can demonstrate the performance differences with no external dependencies, only Go’s standard library, which means it’s simple to include benchmarks in our CI pipeline, run them in our development environment, and ask our colleagues to gather benchmarks for us on their machines.
What was all that about?
OpenTelemetry and Jaeger support Distributed Traces, and while these exercises did not explore that at all, we did see how simple it is to add tracing to an application, how easy it is to run Jaeger, and how immediately valuable trace visualiation can be, even for a trivial application.
Other profiling tools exist for this kind of work, but traces did the job too, and unlike profiler instrumentation, we can - and should - keep the OpenTelemetry code when we deploy to production.
-
Makes Perfect. ↩
-
The book’s implementation doesn’t work for n = 0. Opinions differ on whether 0 is a Fibonacci number. My opinion is: yes, it is. ↩
-
Or knowing a bit about fibonacci implementations. ↩
-
Still nowhere close to the iterative implementation. ↩